

To be successful, one must understand the importance of technical analysis as well as its primary role in trading. The primary role of technical analysis is to predict the right time to enter and exit a trade, which helps in minimizing the risks in trading. But technical analysis wouldn’t be easy without the help of technical indicators and still, these technical indicators are quite confusing for newbies and beginner traders who are still new to the market. One very good thing about MetaTrader 4 trading platform is the user-friendly indicator associated with it. Here are some of the best technical indicators available in MT4 today.
Order History Indicator
Just like what its name suggests, Order History Indicator allows you to check the past trades that you did. When you know your past decisions, you can have a better view of the future moves that you will make. Using this information, you can either replicate or take the opportunity to never do again the mistakes that you did before.
Order History Indicator also enables the trader to change several variables like color and text type, giving you a clear view of your analysis. It also allows you to share your trading history on social media with the use of this indicator.
Moving Average Convergence Divergence Indicator
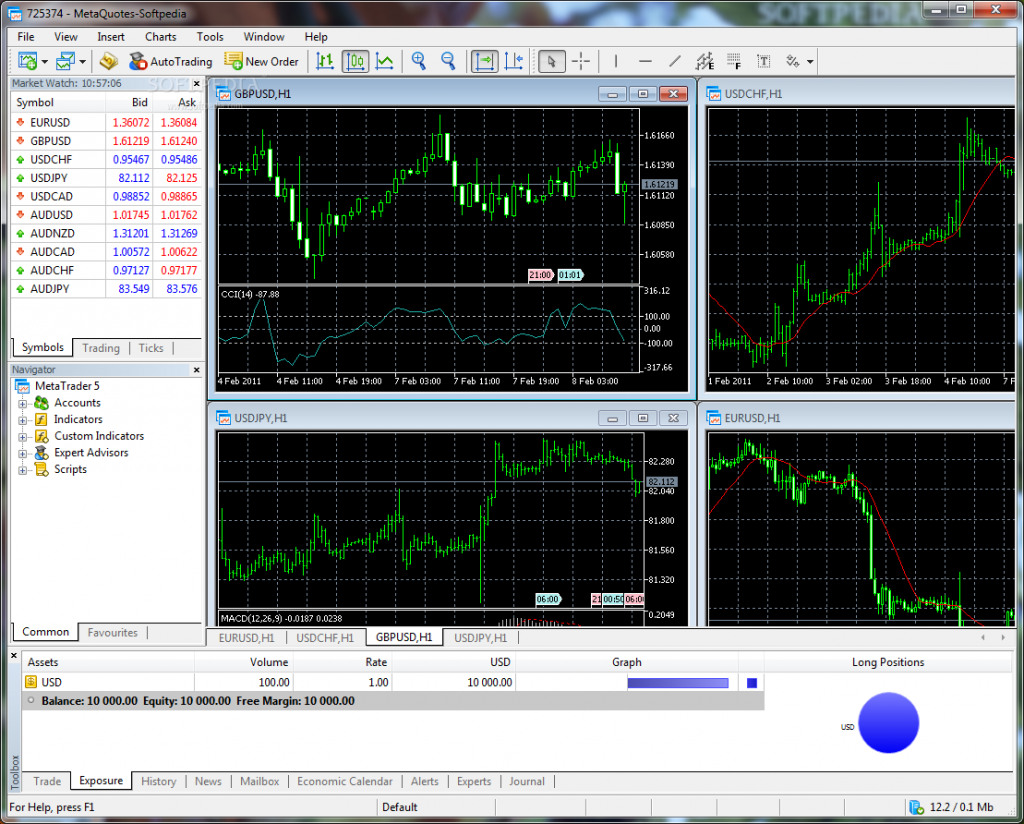
Also known as MACD, this is one of the most used and the best MetaTrader 4 indicators that a beginner can ever have. This indicator is used to determine the relationship between two price averages. If there is a rise in the price dynamics, it will prompt a short-term price average which will let the trade pull away from the long-term average. MACD works magnificently when partnered with signal lines to better determine when to buy or when to sell in the market.
On-Balance Volume
Another free indicator found in MT4 is On-Balance Volume which shows the negative as well as the positive flow of your trading volume. You can achieve this when you add or subtract the trade volume of a particular trading day as you consider the price movement.
The general rule that is followed in the market is that market volume changes first before the price does. Because of that, if there is an increase in OBV it just shows that a currency volume is slowly growing in the bull market.
Bollinger Bands
With the use of this indicator, you can keep up with the market volatility. This indicator is made up of 3 Moving Average lines – the middle line indicates the direction that the market trend follows and the upper and the lower lines are triggered by volatility.
Zigzag Indicator
The most overlooked but very important indicator is the Zigzag Indicator. It has a very simple task of connecting the high and lows. But without this indicator, it will be tough to identify the trends and the support and resistance.
Stochastic Indicator
This indicator works by comparing a certain closing price from a range of other prices at a given period of time. With this comparison, it will be easier for the trader to identify the overbought and the oversought currencies.

